TL;DR
If you want to create a Rolling Average in Power Bi using DAX, skip to here
Why Rolling Average
A common task I have is to analyse the performance of automated warehouses. This might involve monitoring how many cartons pass by on a conveyor or counting how many cartons are palletised by a robot.
When dealing with time series information like the number of cartons per minute, the data can be quite noisy, particularly if you have slugs (groups) of cartons moving together with large gaps in between. A rolling average can help create a visually smoother trend graph.
The below image shows the number of cartons exiting an Automated Storage and Retrieval System (ASRS) in light blue and the dark blue shows the Rolling Average over 10 minutes.

The actual rate of cartons per minute (light blue) sometimes moves from peak to trough quite abruptly, making it hard to get a sense of how we are performing. The Rolling Average (dark blue) removes the peaks and troughs, giving a better picture of throughput over a time window.
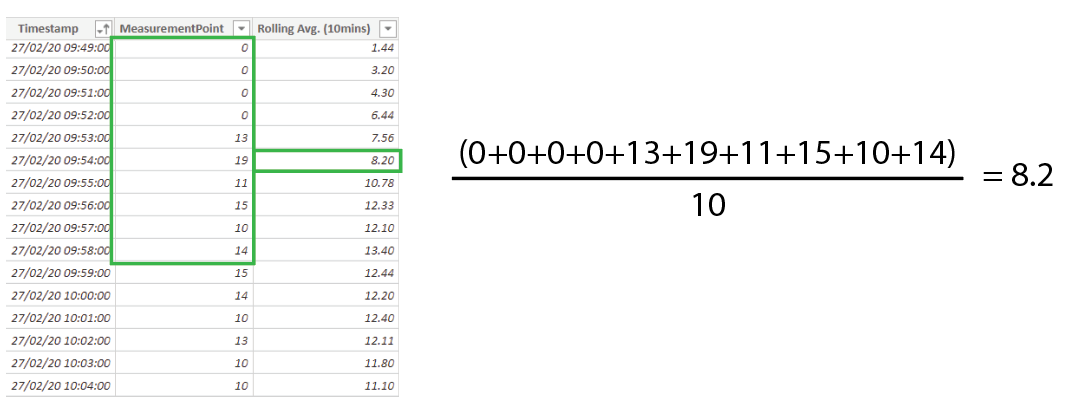
When selecting, let’s say a 10-minute window, I like to select the 5 points before the reference point, the reference point itself, and the 4 points after, for a total of 10 measurement points to get the average of.

We do this for each point, shifting our window down by one as we go.
I prefer to get points before and after for a rolling average as I think it tracks nicely when overlayed over the actual rate. Other people do it differently, and other problem domains like financial might have different expectations. Still, the most important thing is that you understand how the calculation is performed, as the result could be misinterpreted if you don’t know what the rolling average you’ve created is supposed to represent.
So SQL has window functions to help us perform these calculations, but how do we do it in Power BI?
There are many ways to do this, a quick google search will tell you this, but this is how I like to do it.
Rolling Average calculated column in DAX
In our table we create a calculated column with the below formula.
Rolling Avg. (10mins) =

    // Get the current point in time that we are evaluating
    VAR _Current = Rates_Table[Timestamp]
    // How big we want the time window to be, in this case 10 mintues
    VAR _window = TIME(0, 10, 0)

    // Find the start and stop times
    VAR _start = _Current - (_window / 2)
    VAR _stop  = _Current + (_window / 2)

    // Filter the table to only include records withing our time window
    VAR _Table =
        FILTER(ALLSELECTED(Rates_Table),
            AND( Rates_Table[Timestamp] >= _start, Rates_Table[Timestamp] < _stop)
        )

    RETURN
        // Find the average of the measurement point for the selected window
        AVERAGEX(_Table, Rates_Table[MeasurementPoint])
This should now create a column with a rolling average in your table.
Two important points to note for this method:
-
This assumes that you have a row for each interval of time. In this case, it would be every second of the time period, not just the seconds where there was a value.
-
The AVERAGEX function takes the average of all the rows presented to it. So at the start of the table, when you don’t have any preceding values, the missing values are ignored, so a 10-minute average becomes a 5-minute average, incrementing by one each time you progress down the table until there are five preceding values.